Powerful Excel tools built for productive actuaries.
Save time, streamline workflows, and access an evolving toolkit designed by a credentialed actuary.
Product development informed by real actuarial experience.
Built and maintained by a credentialed actuary.
Ideas from working actuaries brought to life.
$149-$199 / User / Year
(Less Than $17 Per Month)
More than an Excel Add-In—your actuarial productivity partner. Built for automation. Shaped by feedback.
Full access to Actuarial Toolkit Suite
Access to ongoing updates and enhancements
Support and ability to request future tool ideas
Local Excel based processing for privacy-conscious actuarial work. No cloud upload required.
Annual renewable license
Subscribe Now▸
System Requirements
Actuarial Toolkit is fully supported on Microsoft Excel for Microsoft 365 (Windows desktop version).
Actuarial Toolkit may function on Excel 2019, Excel 2021, and Excel 2024 for Windows; however, these versions have not been fully tested and are not officially supported. Users on non-supported versions may encounter compatibility limitations, and technical support is provided only for Microsoft 365 on Windows.
Actuarial Toolkit is not supported on Excel for Mac, Excel Online, or mobile versions of Excel.
Actuarial Toolkit Professional V1.0 Features
Dynamic pivot
What It Does
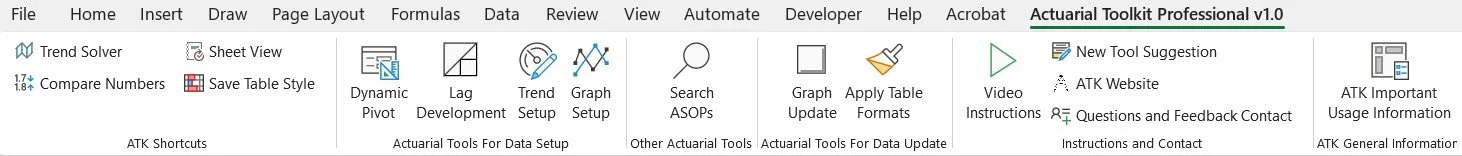
Transform detailed data into dynamic summaries using Excel formulas rather than static pivot tables. Group by one or more variables and calculate metrics such as sums, averages, counts, standard deviations, minimums, and maximums.
Unlike traditional pivot tables, results remain fully formula-driven, making them easier to customize, extend, and integrate into existing models and analyses. Create powerful summaries without writing SQL or rebuilding pivot tables every time a new question arises.
Key Features
Formula-driven summaries instead of pivot tables
Multiple grouping variables and summary metrics
Dynamic outputs that support downstream analyses
SQL-style summaries without writing SQL
Fully integrated with standard Excel workflows
Ideal For
Fast ad-hoc analysis on Excel datasets
Counts, density checks, and data validation by segment
Building tables for larger actuarial or financial models
Experience studies and utilization reporting
Live data summaries during meetings or client calls
Presentation-ready outputs in seconds
SQL-style summaries built visually in Excel
fast, flexible, and formula-driven.
Lag development
What It Does
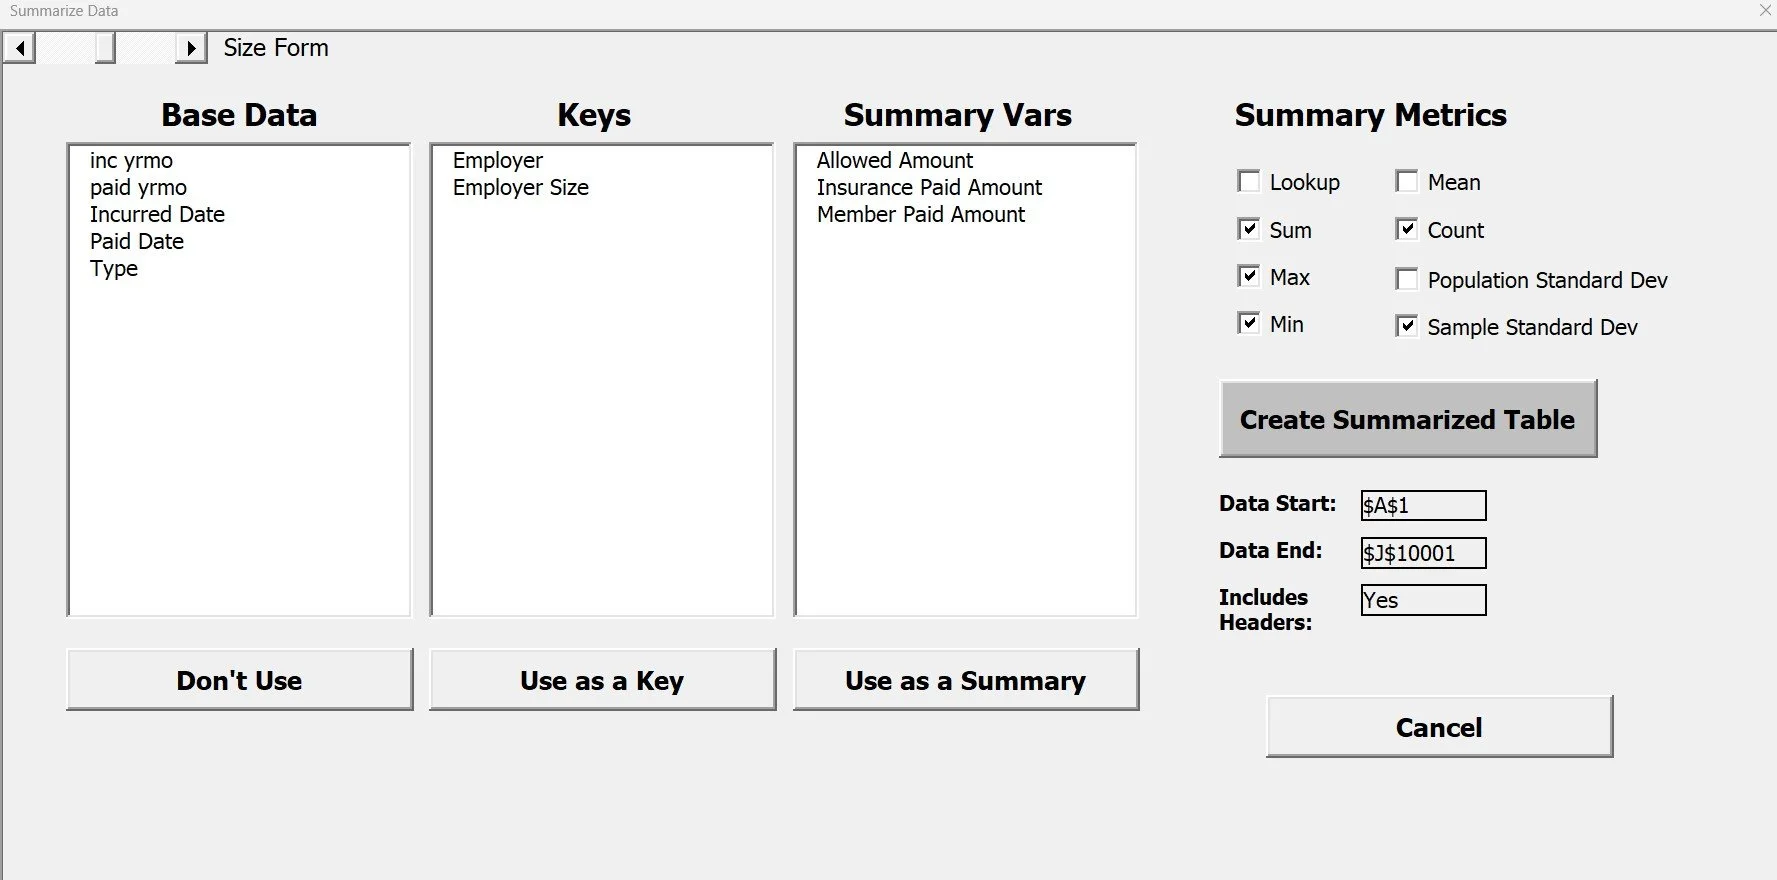
Whether you already have a formal reserving platform or need a starting point, the Lag Development Tool provides a fast and powerful way to understand payment patterns, generate completion factors, and perform flexible actuarial analysis directly in Excel.
Build loss development triangles, age-to-age factors, completion factors, and chain ladder summaries from detailed claim data in just a few clicks. Automatically generate separate analyses by Line of Business, allowing multiple reserving studies to be created simultaneously without repetitive setup.
Key Features
Automated triangle creation from detailed claim data
Age-to-age and completion factor calculations
Chain ladder development analysis
Automatic Line of Business splitting
Flexible origin periods, development periods, and aggregation levels
Excel-based outputs that can be further customized as needed
Ideal For
Reserving analyses
Completion factor studies
Claim development monitoring
Financial forecasting
Multi-line business reviews
Rapid exploration of payment and utilization patterns
Build flexible actuarial triangles in Excel
fast, transparent, and fully editable.
Trend setup
What It Does
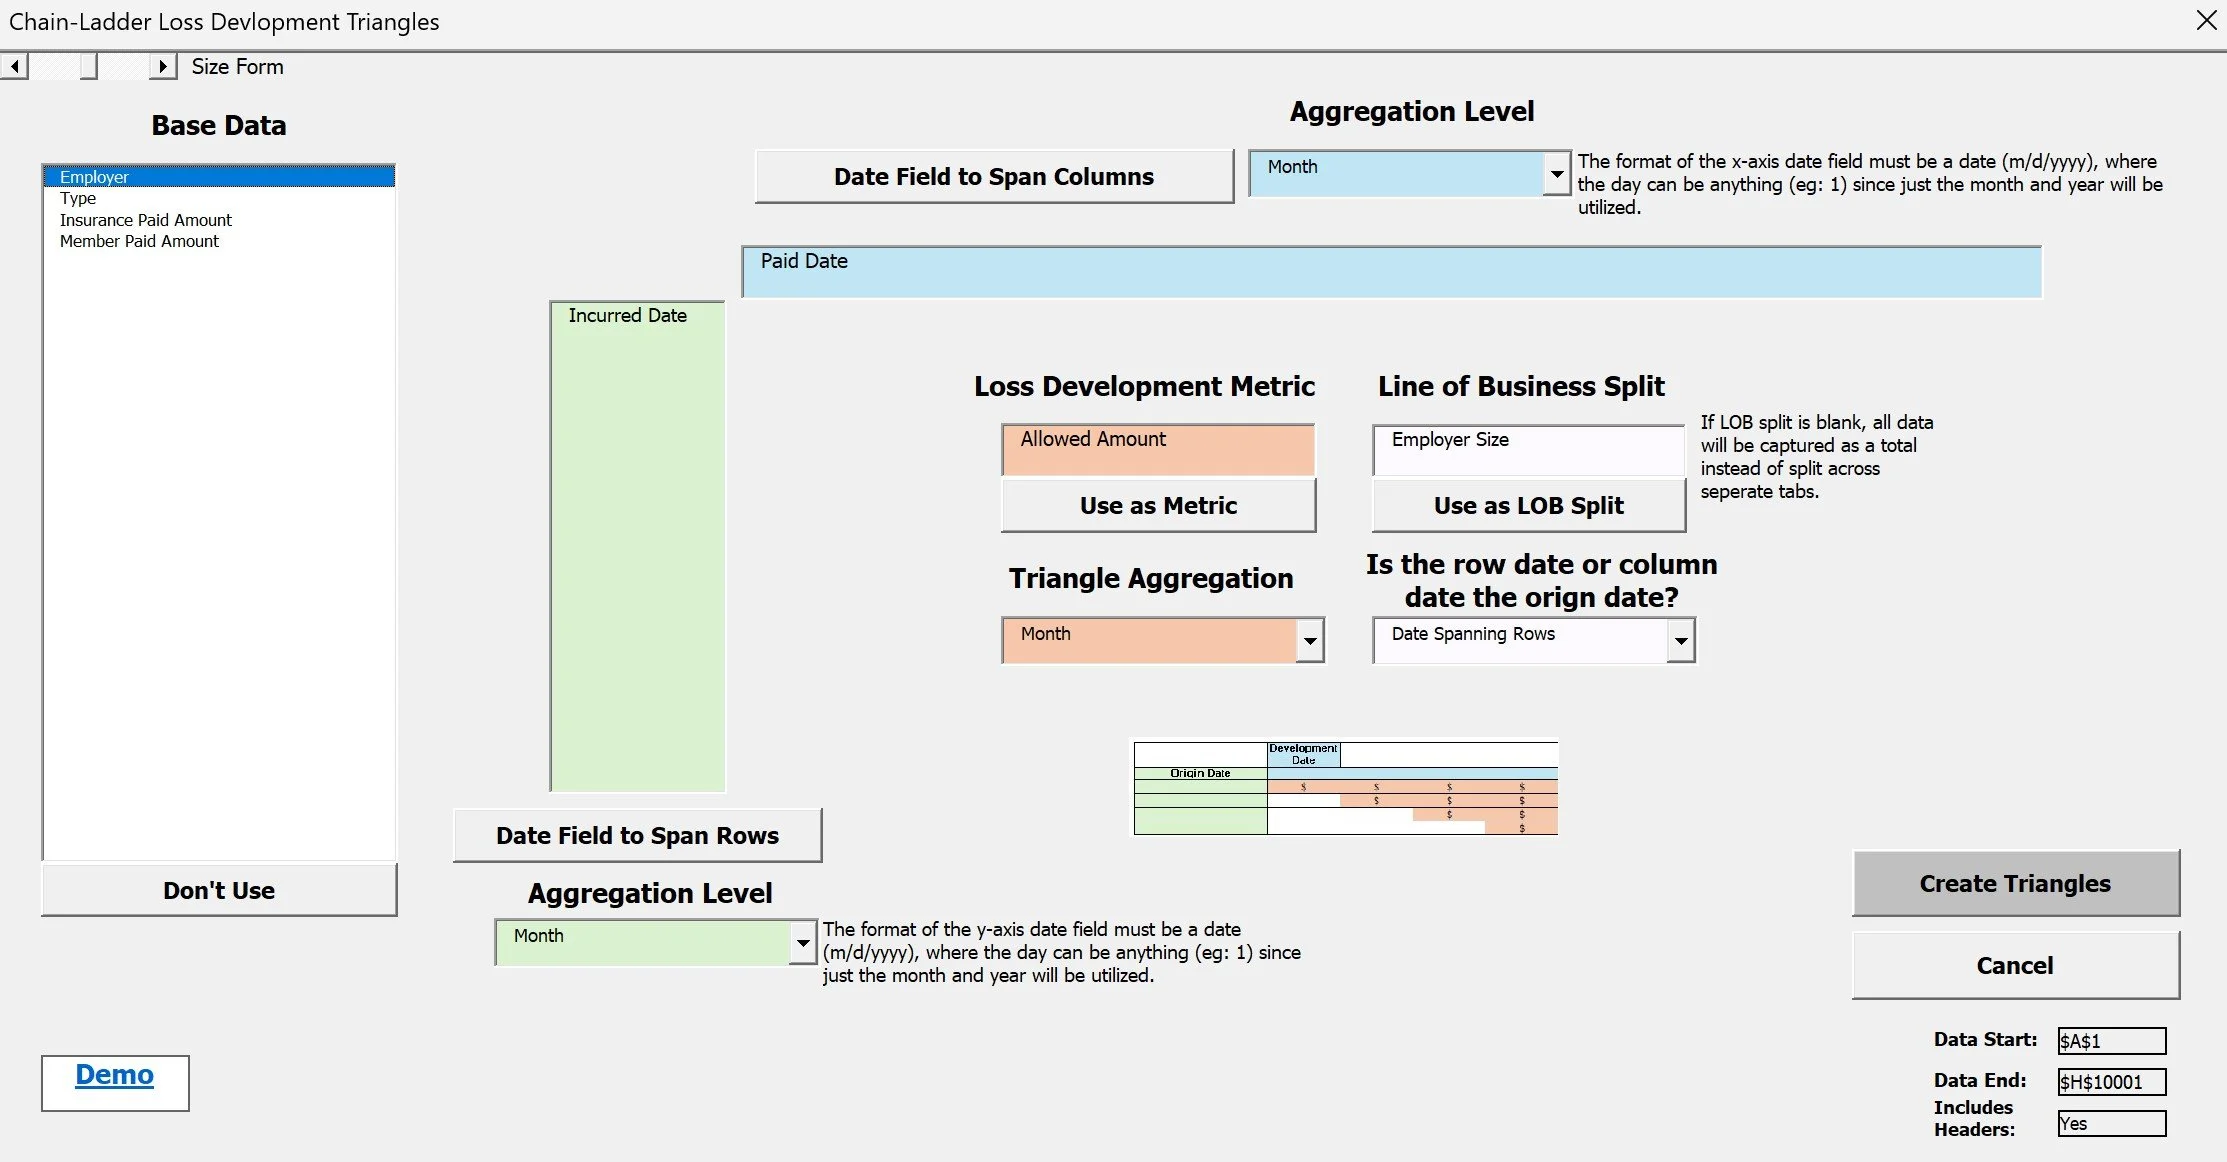
The Trend Setup Tool provides a flexible framework for applying multiple trend assumptions directly within Excel. Users can define historical periods, projection periods, and multiple trend components, then apply those assumptions consistently across their data.
Unlike simpler trend calculators, multiple trend types can be applied simultaneously. For example, separate utilization and unit cost trends can be combined to produce a total projected trend, allowing users to build and evaluate the combined impact of multiple trend assumptions.
Designed for actuaries and analytical professionals, the tool streamlines complex trend calculations while maintaining the flexibility needed for customized modeling approaches.
Key Features
Support for multiple trend components
Simultaneous application of multiple trend assumptions
Historical and projected trend periods
Midpoint-to-midpoint calculations
Flexible projection scenarios
Formula-driven outputs that integrate with Excel models
Ideal For
Medical and pharmacy trend studies
Utilization analyses
Unit cost analyses
Pricing and forecasting exercises
Experience studies
Budgeting and financial projections
Build Trend Formulas Quickly
Select periods, apply trend assumptions, and generate midpoint-to-midpoint formulas automatically.
Graph setup
What It Does
The Graph Setup Tool creates dynamic, presentation-ready Excel charts directly from detailed data. Unlike traditional Pivot Charts, Graph Setup uses formula-driven summaries and flexible filtering options to create cleaner, more customizable outputs with significantly less manual effort.
Users can generate professional line charts in just a few clicks by selecting multiple fields directly from their data. The tool supports multi-select dimensions, measures, filters, and calculations, making it easy to build sophisticated analyses without the limitations of traditional Pivot Charts. Different filters and calculations can also be applied across chart components, providing flexibility that is difficult to achieve with standard Excel charting tools.
Key Features
Formula-driven chart setup instead of Pivot Charts
Professional chart formatting out of the box
Presentation-ready line charts in seconds
Multi-select dimensions, measures, and filters
Different filters for different chart components
Support for custom calculations and aggregations
Dynamic summaries that update with underlying data
Ideal For
Utilization reporting
Financial monitoring
Membership and enrollment reporting
Executive dashboards
Client-ready presentations
Ad hoc data exploration
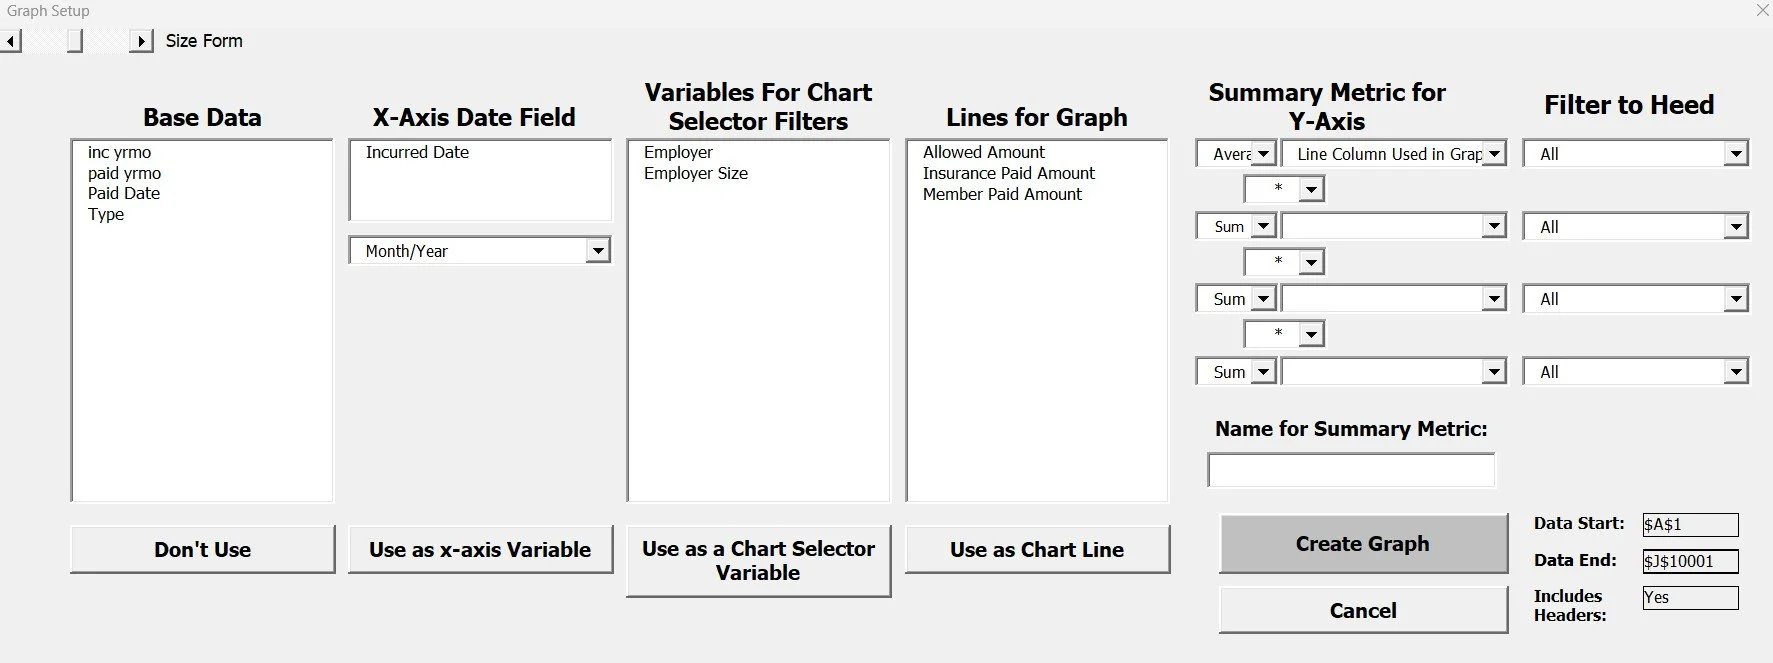
Build Interactive Graphs Fast
Select axes, add filters, define formulas, and instantly explore dynamic graphs across your data.
Search ASOPs
What It Does
Search the Actuarial Standards of Practice directly from Excel. Enter a word or phrase and Actuarial Toolkit scans the ASOP library, returning matching ASOPs along with surrounding text where the term appears. Results are organized into Excel for quick review, documentation, and research.
Key Features
Searches all available ASOPs
Returns matching standards and excerpts
Highlights relevant language
Organized Excel output
Fast professional standards research
Common Uses
Actuarial opinions
Memorandums
Documentation reviews
Peer review support
Professional standards research
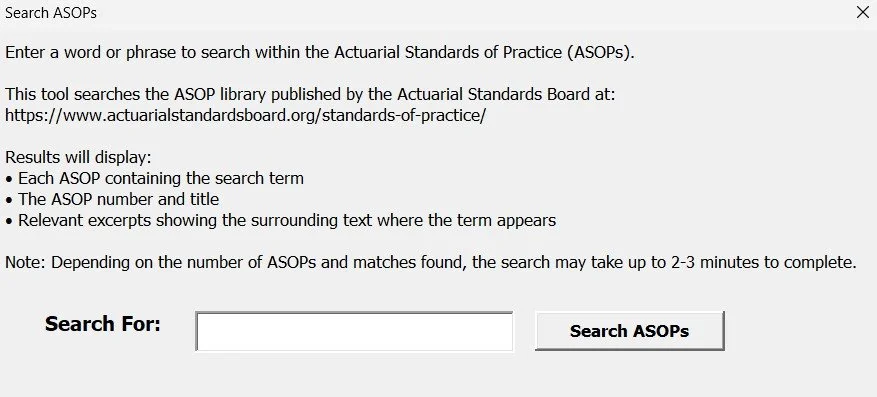
Search ASOPs Instantly
Find relevant Actuarial Standards of Practice, matching language, and supporting references directly from Excel.
Shortcut tools
What It Does
The Shortcut Tools are lightweight utilities built for speed. Whether you're in a meeting, brainstorming ideas, reviewing numbers live, or cleaning up worksheets, these tools help you get answers and complete common tasks in seconds.
They're the kind of quick helpers that save time repeatedly throughout the day, reducing friction so you can stay focused on analysis instead of mechanics.
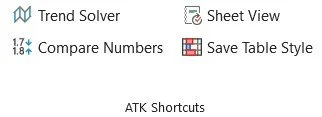
Included Tools
Trend Solver
Select a current value, target value, and number of years to instantly calculate the annualized trend required.Compare Numbers
Select two numbers in your worksheet and immediately view percentage changes, differences, ratios, and other useful comparisons.Table Formatter
Save custom Header, Data, and Total row formats, then instantly apply consistent, professional table styling to any selected range. Turn raw outputs into polished, client-ready exhibits with a single click.Sheet View
Instantly view all worksheets in a workbook and move sheets between visible and hidden views with a single click, making large workbook navigation significantly easier.
Ideal For
Live meeting calculations
Quick what-if analyses
Brainstorming sessions
Cleaning up exhibits and reports
Navigating large workbooks
Fast trend calculations
Small Tools. Big Productivity Gains.
Quick-access Excel utilities designed to help actuaries move faster during meetings, analysis, and day-to-day workflow.